I’ve known for a while that the interactive map of the world showing some of my bloodstain pattern analysis software customers was kind of slow. I also knew that I was using a very outdated version of Google’s API for displaying the data. Yesterday I decided to take a look at it to see what I needed to do to fix it up.
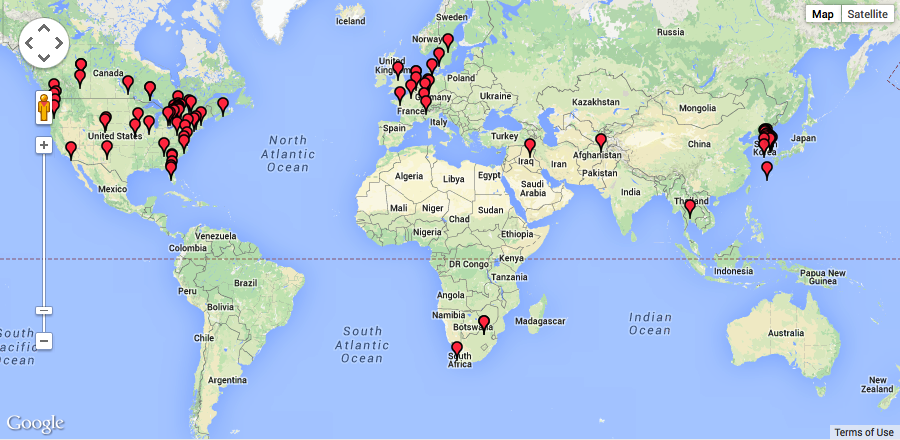
Old Google Map
My first stop was the Google page about moving to v3 of the API. Apparently I needed to get a new API key by signing up for something with my Google Account. Google has added usage limits and now tracks absolutely everything (yes, they probably did before, but now it’s more explicit). I also needed to consider whether or not I can use the maps on a commercial site.
I don’t like hurdles, and I like simplicity, so I decided to look around for alternatives. I remembered looking at OpenStreetMap (OSM) several years ago when I originally built my map and deciding it wasn’t quite good enough. I decided to check it out again to see how they were doing. My how things change!
OpenStreetMap
Because I’m a good lazy developer (by that I mean I avoid writing things when they already exist, are well-coded, and maintainable), my first thought was to grab a WordPress plugin and to use it for my map. I tried out the OSM – OpenStreetMap plugin. While it sort-of worked for what I was trying to do, it was not as customizable as I’d like, it seemed too heavy for one map on one site, and it tied me to WordPress (which my other site hasn’t moved to yet).
My next thought was to look for a JavaScript library with a nice API to integrate and handle most of the heavy lifting. Poking around the OSM site, I ran across OpenLayers. It looked pretty powerful, and has a ton of stuff in its API. I downloaded it (10M?) and took a look but I really just wanted something simpler. Then I found Leaflet. Exactly what I needed. Small, simple, great documentation, and some really straightforward examples.
Leaflet
Even though I had to brush up on some JavaScript, jQuery, and JSON concepts—things I rarely use— I ended up researching possibilities and replacing my Google Map with an OpenStreetMap/Leaflet version in just a couple of hours. It’s now much faster and simpler to customize.
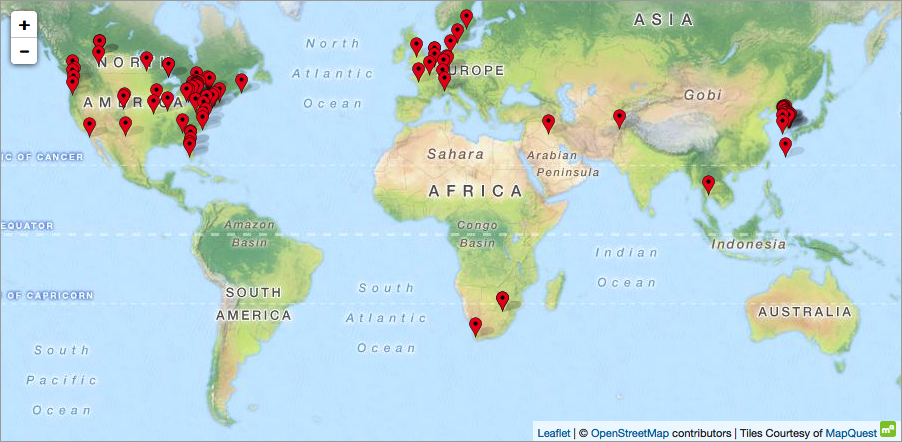
New OpenStreetMap/Leaflet Map
In this article, I’ll step through an example that shows how to:
- set up a simple map using the Leaflet JavaScript library
- load marker locations from a JSON file
- change the marker icon
- have the markers show some data when clicked
As an example, I’m going to create a map showing the countries I’ve lived in or travelled through for a month or more. The example consists of three files and two images:
- index.html – the page itself
- maps/leaf-demo.js – JavaScript to create the map and populate it with markers
- maps/markers.json – a list of markers with their latitude & longitude and a url to display
- maps/images/pin24.png and pin48.png – the pin to display (one for normal display, one for retina)
(The files used in this example are available on GitHub. Note that the version on GitHub might look different that what is outlined here since it has been updated to use more recent versions of the libraries. I recommend using it instead of copying the code on this page.)
The HTML
Let’s start by taking a look at the HTML.
|
1 2 3 4 5 6 7 8 9 10 11 12 13 14 15 16 17 18 19 20 21 |
<html lang="en-US" xmlns="http://www.w3.org/1999/xhtml"> <head profile="http://gmpg.org/xfn/11"> <meta http-equiv="Content-Type" content="text/html; charset=UTF-8" /> <link rel="stylesheet" type="text/css" href="http://cdn.leafletjs.com/leaflet/v0.7.7/leaflet.css" /> <script type='text/javascript' src='//ajax.googleapis.com/ajax/libs/jquery/2.0.3/jquery.min.js'></script> <script type='text/javascript' src='http://cdn.leafletjs.com/leaflet/v0.7.7/leaflet.js'></script> </head> <body> <h1>Leaflet Example</h1> <p>Here's a map of the countries I've either lived in or travelled through for a month or more. <div id="map" style="height: 440px; border: 1px solid #AAA;"></div> <script type='text/javascript' src='maps/markers.json'></script> <script type='text/javascript' src='maps/leaf-demo.js'></script> </body> </html> |
This file starts out with standard HTML header stuff, so the first interesting lines are these:
|
5 6 7 8 |
<link rel="stylesheet" type="text/css" href="http://cdn.leafletjs.com/leaflet/v0.7.7/leaflet.css" /> <script type='text/javascript' src='//ajax.googleapis.com/ajax/libs/jquery/2.0.3/jquery.min.js'></script> <script type='text/javascript' src='http://cdn.leafletjs.com/leaflet/v0.7.7/leaflet.js'></script> |
These lines pull in the CSS and JavaScript libraries we need to display and work with the maps. In this example, we are linking to these files stored on a remote server using a CDN. Another option would be to host these files ourselves, but the advantages of using these CDNs are:
- lightens the load on your server
- CDNs distribute the content so it’s closer to the user, resulting in faster downloads
- browsers limit the number of HTTP requests to each host, so accessing multiple, different hosts allows fetching data in parallel, resulting in faster display of the page (we’ll see this idea again with the tiles which make up the map)
- if a user has visited another site using the same script, it may already be in the user’s cache resulting in no download at all and faster display of the page
This example uses cdn.leafletjs.com to get the Leaflet CSS and library and ajax.googleapis.com to get the jQuery library. Note that leaving the protocol off the Google URL is not an error – this is a protocol relative URL (a.k.a. scheme-less URI).
(Update: I was using MAMP to write and test this. It’s the web server which adds the correct protocol to scheme-less URIs, so if you just open the file on its own, browsers will not add it properly. You will need to add http: to the ajax.googleapis.com URI for this to work. I have updated the download to fix this.)
The next interesting part of this HTML file is this div:
|
16 |
<div id="map" style="height: 440px; border: 1px solid #AAA;"></div> |
We’re creating a div called “map” with a height and a border. This is the div that is going to be filled in with our map when we create it in our JavaScript. If we do not specify a width, it will adjust the width of the map to the page dynamically.
The last part of this file is the key. This is where we load the JavaScript that does the work of setting up and displaying our map.
|
18 19 |
<script type='text/javascript' src='maps/markers.json'></script> <script type='text/javascript' src='maps/leaf-demo.js'></script> |
The first script is a JSON file with our marker information and the second is the code to setup and display our map. Note that the second script has to come after the map div is created so the JavaScript has something to target. In this case, we’re loading a local file, so let’s take a look at that next.
The Leaflet JavaScript
Our initial JavaScript is pretty straightforward. All we are doing here is creating the map and adding a tile layer. The tile images are coming from the OpenStreetMap servers which are good for testing. Note that they say on their site:
Apart from very limited testing purposes, you should not use the tiles supplied by OpenStreetMap.org itself.
|
1 2 3 4 5 |
var map = L.map( 'map', { center: [20.0, 5.0], minZoom: 2, zoom: 2 }); |
This creates a new map, assigns it to the ‘map’ div and sets some options. In this case we are centering the initial view at 20° latitude and 5° longitude, setting the minimum zoom level to 2 and the default zoom level to 2. There are many other options you can set here to tweak the way you want your map displayed.
|
7 8 9 10 |
L.tileLayer( 'http://{s}.tile.openstreetmap.org/{z}/{x}/{y}.png', { attribution: '© <a href="https://www.openstreetmap.org/copyright">OpenStreetMap</a>', subdomains: ['a','b','c'] }).addTo( map ); |
This code adds a layer to the map telling it what set of tiles to display and where to get them. There are several different servers you can use – or you can host your own.
Again, Leaflet has many options to use when creating a tileLayer. In our example, the first argument is the URL template so Leaflet knows how to fetch the tiles from the servers properly. Next is the attribution – this is what shows up in the bottom-right corner of the map. It is important that you add the right info here for proper attribution of the tile set.
Finally we have a list of subdomains. This array of strings is substituted into the {s} portion of the URL template. Note that this list depends on the tile servers you are using. This option allows a browser to download from several servers at the same time (remember I mentioned this when explaining CDNs above?) which results in faster loading of the page and faster updates as the user drags around the map. One of the problems I had with the old Google solution is that it only used one server, so it was slow. This capability makes it much faster.
OK, so now we have an interactive map we can drag around and zoom in and out. Let’s add some markers to it.
The JSON Data
Although it is possible to put the marker data right in with our JavaScript file, I like keeping my data in a separate file so it’s easy to swap out or update without modifying the main file.
For this example, I’m using JSON as a little database to store the country name, Wikipedia url, and longitude and latitude of each of the countries I’ve either lived in or travelled through for a month or more.
|
1 2 3 4 5 6 7 8 9 10 11 12 13 14 15 16 17 18 19 20 21 |
markers = [ { "name": "Canada", "url": "https://en.wikipedia.org/wiki/Canada", "lat": 56.130366, "lng": -106.346771 }, { "name": "Anguilla", "url": "https://en.wikipedia.org/wiki/Anguilla", "lat": 18.220554, "lng": -63.068615 }, ... { "name": "Japan", "url": "https://en.wikipedia.org/wiki/Japan", "lat": 36.204824, "lng": 138.252924 } ]; |
To read this data and add the markers to our map, I just loop over the array and call the Leaflet function to create markers:
|
12 13 14 15 16 17 |
for ( var i=0; i < markers.length; ++i ) { L.marker( [markers[i].lat, markers[i].lng] ) .bindPopup( '<a href="' + markers[i].url + '" target="_blank" rel="noopener">' + markers[i].name + '</a>' ) .addTo( map ); } |
Leaflet’s markers offer many options for customization. In our example, we are creating a marker at a specific location, binding a simple popup to it, and adding it to our map. The latitude and longitude and the data to display in the popup (the country name and link to Wikipedia) are read from our JSON file.
So far, so good, but those markers are kind of big, so let’s swap them out for our own icons.
Changing The Icon
I found a free pin icon over at clker.com that I thought would look good on this map. I played around a bit with different sizes and settled on a height of 24 pixels. I created two versions: the regular version with a height of 24 pixels and a double-sized version for retina displays with a height of 48 pixels. And of course I ran these through ImageOptim to compress them as much as possible.
Since we are going to add our own icon, the code we did in the last section needs to be changed a bit. Here’s what we have now:
|
12 13 14 15 16 17 18 19 20 21 22 23 24 25 26 27 |
var myURL = jQuery( 'script[src$="leaf-demo.js"]' ).attr( 'src' ).replace( 'leaf-demo.js', '' ); var myIcon = L.icon({ iconUrl: myURL + 'images/pin24.png', iconRetinaUrl: myURL + 'images/pin48.png', iconSize: [29, 24], iconAnchor: [9, 21], popupAnchor: [0, -14] }); for ( var i=0; i < markers.length; ++i ) { L.marker( [markers[i].lat, markers[i].lng], {icon: myIcon} ) .bindPopup( '<a href="' + markers[i].url + '" target="_blank" rel="noopener">' + markers[i].name + '</a>' ) .addTo( map ); } |
In this code, the first thing I’m doing is grabbing our URL and removing the file name so I can create a URL for the icons. Not being a JavaScript guru, I’m not 100% sure this is the best way to do this, and it feels hacky, but it does work. (If you know of a better way, please contact me!)
The next line declares a var myIcon to hold our new icon. Leaflet’s icon allows you to specify all sorts of things, but the key ones are the ones we use here. The iconUrl, iconRetinaUrl, and iconSize options are self-explanatory. The iconAnchor is the pixel location in the icon file that corresponds to the specific latitude and longitude. The popupAnchor specifies where the popup should be located relative to the iconAnchor.
One last thing to do with our new icon is actually apply it. To do that, we simply add it as an option when creating our markers {icon: myIcon} (line 24).
Voilà!
Final Result
Here’s our final result – an interactive map indicating the countries I’ve either lived in or travelled through for a month or more.
If you end up with too many markers on your map, consider using Leaflet.markercluster to cluster them!
I hope this is useful to someone out there in internet-land!
As always, if you have suggestions on how to improve my code or make things easier, please comment below or feel free to contact me.
Project Files: The files used in this example are available on GitHub. Note that the version on GitHub might look different that what is outlined here since it has been updated to use more recent versions of the libraries. I recommend using it instead of copying the code on this page.
Update 06 May 2021 (GitHub code):
- Updated to Leaflet 1.7.1 and jQuery 3.6.0.
- All files reformatted with prettier.
- Use https for URLs.
Update 12 July 2016: MapQuest discontinued the tile set I was using, so I switched to OpenStreetMap’s tiles. Note that these are useful only for testing. They say on their site:
Apart from very limited testing purposes, you should not use the tiles supplied by OpenStreetMap.org itself.
Update 12 July 2016: Updated example to use Leaflet 0.7.7 (no code changes, just including newer version of javascript).
Well done, this is a great article super help.
Love the simplicity and the ease of setup.
Thanks again !
Hi Andy,
First great job, very clean and easy.
I currently use OpenStreetMap, OpenWeatherMap together to display weather in a PopUp. Works fine. But I like your way with the link and all. Is there a way to have your PopUp display another PopUp when the link is pressed?
I would like to stay on the same page and populate the new PopUp with my weather.
Thanks in advance
Sam Elliot
Can you give an example of how to use an image (like an ocean picture) (instead of a map) as the base background?
I have scanned the internet upside down, inside out, and couldn’t figure out how to do it.
Thanks ahead
Yasmin
There’s an “official” tutorial on this. See Non-geographical maps.
I’ve never tried it myself…
Hi Andy,
I am a Python Developer and I have been working on a project to visualize data on the leaflet map via folium and had a question regarding that. Is there a usage limit or performance limit in leaflet as I tried to plot 150k markers on the map according to the latitude longitude but the html generated did not open in any browser and just showed a blank page whereas when I reduced the markers to 14K I was able to view the map on the browser. Is there a solution to plot millions of markers on the map ?? Also, instead of the entire world map can I use the map for a single country. Will it reduce the load and help me plot millions of markers on my country map? Is there a solution?
I don’t know as I’ve only ever used it for dozens of markers. You could look at clustering to help reduce the number of items displayed (and make it more usable for humans).
You can change the map to whatever you want – I mention it somewhere in the comments above – but I’ve never done it. Maybe look at the official Leaflet docs?
StackOverflow might be a better place to ask these things since they are beyond the scope of this tutorial.
Good luck!
Maybe don’t plot them all at once, just those within a smaller area of interest. My recent project has 26,000 shape files in the database but only plots a few at a time.
Hi,
Thanks so much for your tutorial – I’ve just started to use Leaflet and I’m also not very experienced with js, so it’s been really good to follow your example.
I of course have a question – in my use case I am trying to dynamically write the markers.json file that then gets passed to the map, which your js code loops through and plots the markers. However, instead of defining the icon in the loop such that every point has the same icon, I’d like to define some custom icons in the js file (which works), and then pass the icon variable name as defined in the .json file to the for loop (as well as the lat, long, etc).
No matter what I’ve tried so far, I cannot get the icon name to pass from the .json file into the for loop. I can define a custom icon and call it directly in the for loop, but then all points have the same icon. Any suggestions? Thanks again!
I’ve never done this (and I use JavaScript as little as possible), but I would start by defining an icon class and then creating a var for each icon. There’s an official tutorial to show how to do this.
Then you need to map a string from the JSON to the variable somehow. The first thing that comes to mind would be to use a switch statement. Use that to call setIcon() on the marker.
So – after you’ve set up the variables for each icon – something like this:
Caveat emptor – I didn’t try this. There’s probably a better/more efficient way to do it, but this idea should get you going and then you can refine as necessary.
Thanks! I was able to follow that, and I’ll give it a go this evening. All the best.
Worked like a charm, it was the mapping a string to a variable that I was having trouble with before. Thanks very much!
Hi Andy,
thanks for nice tutorial !
Is there a way to read the markers.js file at regular intervals (5 minutes) to have the map updated ?
I would approach it like this:
You could get more intelligent about it by keeping the old list and then updating only the changes. It depends on how many markers you’re dealing with.
Hey Andy, great tutorial thanks.
Do you know how I could add the markers from a mysql db? I’m going round in circles!
Thanks
Alex:
Search this page for “sql” for my previous responses to this question.
Hi,
Are you sure this is free for commercial use, I tried to use openlayers with OSM, however that seem to hit OSM tiles, same is your case.
https://c.tile.openstreetmap.org
And OSM tiles are not free for commercial use.
My second-to-last update at the bottom of the post mentions OSM tile usage.
There is nothing in their policy that prevents commercial usage – they have a list of requirements that must be followed and they require that you don’t abuse the system.
From their policy:
If maps are critical for your business (i.e. losing the tile set would cause any problems) I would not use this tile set. I would find a provider and pay for it.
Hi Andy,
thank you for the nice tutorial.
Is it possible to add different images to different marker popups and add some text?
I was thinking like this, but this of course does not work:
markers = [
{
“name”: “Canada”,
“url”: “https://en.wikipedia.org/wiki/Canada”,
“lat”: 56.130366,
“lng”: -106.346771,
“image”: “http://localhost/images/image-canada.jpg”,
“text”: “This is just some random to to be displayed in the popup marker.”
];
You (almost) have the first part – adding the data (you’re missing a “}”). Now you need to use it.
In the last section of code I have:
what I’m doing is creating some HTML to display when you click a marker.
So you would need to add an img tag for your image and use your text somewhere.
Something like (untested):
Hi, Andy how can i download my map image?
You mean like a snapshot of the current view? I’m not sure.
You might be able to do something with HTML canvases to grab it? Maybe something here can point you in the right direction.
Hi Andy,
Thank you for great article!
I’m looking for a way for members of a group, who are just given the URL to the map, to add their own location to the map, but without being able to edit the map settings otherwise.
Is that possible with this setup?
This is not possible with this setup because the points are stored in a text file. You will need some kind of persistent storage (i.e. a database) in the back end which means a more complicated setup.
Search the comments here for “database” for my other responses to this question.
I tested the code by myself with the github files, and chrome didnt show the map markers, firefox and vivaldi block them. Do you may have an idea why?
I have replied to this on GitHub.
Hello Andy, thanks for your great source, it helps me a lot for my own projects. I just have a question. How can I add (e.g.) a telephone number? I tryd with copying the url code line but it doenst show up anything. I would be very happy if you have an helping idea. 🙂
1) Add a field to the JSON for the phone number called “phone”
2) Where we are doing bindPopup (see The JSON Data section above), simply use markers[i].phone where you want to put the phone number
Hello Andy,
I have almost done the same as i am also converting from google -> something new.
My setup is the 80% the same, but in my case i directly generate the markers from a db with custom icons.
But i am stuck with the following and you might give me some tips. I would like show some extra information in a seperate div on the bottom of my page. I like to this with an on rollover marker.
I search the leaflet doc but i can’t find a rollover trigger.
How would you tackle this issue???
Kind regards,
Keeping in mind I’m not a JavaScript expert, can you not just use mouseover on the marker? I don’t think you need anything leaflet-specific.
Something like:
This is a great tutorial and has helped me to conquer approx 80% of my task, only I have retrieved my markers from a csv file created from a database so it can be regularly updated.
However the one thing I need, and probably the most improtant function is to be able to enter a users location and then the stores within a given radius appear. Do you know how to do this, point me to some examples or know which addons I need to use?
Very grateful for any advice you can provide.
Paul:
I’m really not a web guy, but maybe you can use the Geolocation API?
Or do you mean have the user enter an address and convert that to lat/long? In that case I think you’ll have to find a 3rd party service to do that lookup.
Hi Andy,
Thank you for the info. I have managed to do exactly what I was after and more using leaflet.js and turf.js
Thanks for setting me off on the right path!
Thanks Andy,
This was very helpful and straight forward. I had hard time with openlayers, even though it has a big api library, its codes were clumsy and newer releases are not backward compatible…. need to rewrite codes.
You’re welcome Gabriel! I’m glad it helped.
Struggled three mornings trying to solve a problem using “openlayers”. Now I found your solution using “leaflet”. Problem solved within 2 hours. Thank you very much.
You’re welcome! I’m glad you found it useful.
Can we pick location from map using this?
If by “this” you mean Leaflet, then yes.
The Leaflet Quick Start Guide shows how to use onMapClick and you can find all the available events in the documentation.
I love seeing a tutorial survive the test of time. In 2019 I was able to use your thorough process clarification from 2014 to trouble shoot my own implementation. This is a well written how-to. Thanks for taking the time. My particular map is for fun and is an interactive map of my son’s minecraft server world. I’m feeding the markers from a shared google doc and I’ll have it complete as soon as I figure out exactly how I’ll adjust the coordinates to match his minecraft coords instead of an assumed earth coord CRS. More complex than I bargained for, but that’s why I love doing this stuff. To learn a new set of tools on a non-critical implementation. I mean VERY IMPORTANT work (if my son is reading this).
Thanks a lot Scott! I appreciate it.
If you haven’t seen it already, you might want to take a look at one of the official tutorials on non-geographical maps called Not of this earth.
Thanks a lot. Its working fine. I faced certain hurdles while implementing in angular 7. But got it fixed.Especially while importing leaflet library.
First of all I want to congratulate you, great tutorial.
I have some layers separated by groups in QGIS and I’m having trouble taking those groups to Webmaps.
Ex: I have a group of Water Resources. in it I have layers of Rivers, Lakes, Ponds, Reservoirs and wells drilled and in another group I have the territorial limits like Municipal Limits, States, and Countries.
Hence my doubt.
How can I take these groups where in layer control I can activate each layer separately?
I do not know if I was clear, but I am a beginner and I am a great innovator of these new technologies.
Thanks in advance.
There’s a tutorial on the main Leaflet site that shows how to do this: Layer Groups and Layers Control.
Good luck!
Excellent Tutorial! Thank you Andy
You’re welcome! Glad it was useful.
I wish someone would make a tutorial of using your own map image (for a game for instance)…
How about this “official” one?
Hello Andy ! Thanks a lot for this tutorial ! It was realy clear and simple
But i’d like to know how to make a search box, just like osm, but how can i find an api or a database for this ?
I’ve never done this, but – depending on your site and your data – I think you should be able to do it all in JavaScript. It looks like there are some leaflet plugins to add search.
Hi Andy!
many thanks for this tutorial…like many others, I’m not a developer and this is clearly exposed. Starting with your tutorial (one CSS file, one html, one js and one json files) , i tried to make my own map with many JSON files. It works fine but when I try to create a new layer, I still have previous layers… Do you know how can I delete previous markers before creating new ones ?
I found some hints on web but I’m very confused and still stuck . Do you know where I should add a clear option in your example ?
Many thanks for you help!
Guillaume
PS: here ‘s my code : (I’m trying to plot temperature in different locations, the user will be able to select a specific month)
Without being able to work with your entire example, my best shot is this:
Example (untested):
…or something like that. Basically the idea is to keep them all in a group and clear it as necessary.
That’s great ! you helped me a lot !
Many thanks for your help.
Hi Andy!
You did a great job here. I’m not a programmer but I managed to create my map anyway. I have just one question. Now that the map is done, how can I embed it on my wordpress website? I did a lot of research online but couldn’t find a solution.
Thanks Igor.
This is a little too complex to explain without another tutorial 🙂 Generally, you need to:
You can see these in the example index.html – there’s a div with an id of “map”, several script tags linking to JavaScript, and a link for leaflet’s CSS.
The way I handle it on my sites is a little complicated so that I can control things better, but you’ll need a way to link JavaScript and CSS to a specific page. I don’t think you can do this by default, but there is probably a plugin for it.
When i am trying to export leaflet map into PNG image in safari browser it gives me below error message :
SECURITY_ERR: DOM Exception 18: An attempt was made to break through the security policy of the user agent.
its working fine with chrome but issue with safari. Please suggest me sample code
I don’t use Safari, but I’ve never seen this error. What does googling it tell you?
Sounds like a server misconfiguration or a JavaScript problem.
Hey ! Very useful tutorial !
But I have 1 question, do you know how to do it but instead of using JSON files, using SQL database and PhP ?
As I mentioned above using persistent storage was beyond the scope of this tutorial.
The way I would approach it is to create a little REST API server using a language such as Go (or whatever language you’re familiar with – Python, PHP, etc…) and access it from the JavaScript to read & update markers.
Thank’s a lot !
Hi can I add another name like if there is CANADA, i’ll add another name ? is it possible
I’ll need more information – I don’t understand the question. Can you give me an example if what you’re trying to do?
Hi
Trying to run this in the json file and it gets rejected:
“details”: “favoriteMusic: ‘<a href=”#” rel=”nofollow”>80s Rock</a>'”,
I thought the single quotes should be enough. I also tried this:
“details”: “favoriteMusic: ‘<a>80s Rock</a>'”,
Any ideas how I might achieve this please?
Thanks
Rich
If I understand your question, it’s about how to use double quotes within double quotes? You can escape them using ‘\’ like this:
(WordPress is adding the extra rel=”nofollow” – please ignore 🙂
Hi Andy
I have used the escape in the code but it doesn’t work. This is the site I am working on:
http://ewh2015.evergreen.software/walking-map-uk-routes-lands-end
The markers don’t load as soon as I add a link.
Thanks
Rich
I’m seeing links in the marker popups on that site. ?
Looks like that page inlines the javascript so I inlined it like this in the index.html page and it’s working for me.
I guess the difference is you aren’t using json to hold the markers anymore. Why not? It’s a lot easier to manage and will make your code shorter.
Aside: I would suggest not inlining this code – leave it in its own file so it’s easier to manage and can be cached properly. Also there’s an awful lot of redundant code there – I would refactor it. customOptions doesn’t need to redefined over and over again for example.
Thanks for the reply. I unfortunately handed over the coding to another firm. They have changed the code and I am now finding a few issues with it. Not sure what to do next but thanks for all the help.
Rich
Further to my note of earlier. I can see from the debug screen (I am not an expert) that the file ‘markers.json’ is receiving a 404 file not found error.
That explains why the script abends at the first reference to its contents.
The file markers.json is certainly on the web. I have also looked at my mod settings and they are all 777 which I believe is fine.
I have also disabled my anti-virus and firewall and an app or two in Firefox – no change.
The same fault occurs with Explorer.
Geoff:
It’s possible your web server doesn’t like the .json extension on that file. You can try changing it (and the corresponding script tag in the HTML) with .js.
(See comment above.)
Thanks – that is it!!! A simple name change to dot-js.
I am totally perplexed as to why – but very grateful for your help and a great demo/tutorial.
Great tutorial – thanks
I do have a problem
The copy of Leaflet-Example from GitHub work perfectly from a PC directory. BUT when index.html is run from a web server hosting the same files the map appears fine, but the markers are not displayed?
I have not been developing JaveScript for long but I have played around with the script. I think the script runs fine until the for loop in leaf-demo.js where it tries to resolve the value of markers.length. My thoughts are that the script ab-ends at this point.
Am I right that the leaf leaf demo pages can be dropped onto a web server and run unchanged?
Thanks
Geoff
Thanks for this tutorial Andy! I was having the hardest time following another Leaflet/Mapbox tutorial but then I came across yours. You broke it down easily and I was able to understand the components. After actually being able to see your maps work in my browser, I returned to the other tutorial with a better understanding and was able to make it work
Great! Thanks for letting me know you found it useful.
Is it possible to make of this for offline uses?
I’m sure it’s possible, but I’ve never considered it so I don’t know how much work it would be. You would need all the map tiles stored in way that you could access them locally with a file URL instead of https. So maybe a database of some sort.
You might get some ideas here: How to make offline maps(using leaflet OSM), by caching? or trying a search for using leaflet offline.
Thanks for tutorial….
Great writeup! Kudos there
Please which tile can I use in production given that OSM seem not appropriate?
Thanks!
I’m not sure what tile set people should move to. I’m obviously using OSM here, but I’m not getting thousands of hits a day…
Maybe someone else has a suggestion?
Hi Andy, just need to know how can I achieve offline map using leaflet & osm .mbtiles
I have tried this approach ,
So currently stuck in step 3. Any idea in parsing the tiles from db files and creating tile layer ?
Thanks in advance.
I’ve never tried to do this offline, but you’ll need some way to access the SQLite database from the JavaScript – which I’ve also never tried to do. A quick search turned up this:
Is it possible to access an SQLite database from JavaScript?
People are recommending sql.js.
Thank you very for much. I have to admit I have no idea what you are trying to accomplish here:
Can you not just specify an absolute URL? eg.
iconUrl: ‘http://myserver.com/markers/marker.png’
Colin:
You can use an absolute URL if you like, but it’s usually a bad idea to hardcode a URL like that.
This code is pulling the leaf-demo.js off the URL so I can reference the file I want using the rest of the URL. This makes it site-independent. I use this code on multiple sites, have moved things around a few times, and switched them to https. Having it hardcoded would just add another thing to change or break.
Like I said – might not be the best way to do it. I haven’t revisited this in a long time, but I’m sure I could come up with something better.
Hello guys,
I am trying to create a Mean stack app with leaflet js.i am facing issue to display place name on the map on the basis of latitude and longitude.i have created a connection with mongodb and imported json file into mongodb to retrieve the json data with the help of express and node js but i am confused with what url should i use for ajax call and how i will use the data retrieve from ajax call with leaflet js to display it on map.
Hi… I have tried your map in my project. It has successfully worked before two weeks but now it show “Direct tile access has been discontinued”. I need this map in my application permanently. What are I will do for that ????
Other than immediately posting here, what have you tried to fix your problem?
I didn’t do anything. The message show like this “MapQuest + Developer. As of July 11,2016 direct tile access has been discontinued. Please visit our Blog post for more information.” But actually I can’t access blog using my net connection. I hope you will give a solution for my problem.
You need to stop using mapquest tile set and use Open Street Maps tile set.
http://wiki.openstreetmap.org/wiki/Tiles
It says it in almost the last line of the blog post. Use a different tile.
new map needed:
Thanks Joe!
Thanks for update Joe and thank you very much Andy for this article, it has been invaluable, great job!
Hi..
This is very useful for my project. I have search some other site but I didn’t got an idea but this is very useful. thanks.
And I have a doubt…
What are the other input methods for giving the plotting point like JSON???
is it possible to take values from Data Base tables??
You can use any format you like to store the information. If you wanted to store it as a CSV, you could do that and then modify the JavaScript to parse the CSV and fill in the proper fields. I chose JSON because it is the most natural fit for JavaScript.
It is, and that would allow you to create a dynamic site – adding and removing points and so on. But this would be a much more complicated program and is beyond the scope of this example.
If I were going to approach that problem I would create a little REST API server using a language such as Go (or whatever language you’re familiar with – Python, PHP, etc…), connect it to a database such as ArangoDB, and access it from JavaScript to read & update markers.
Ok…Thank you…The given information is very useful. And I have one more doubt. I have developed a Web apps with help of your code. The problem is I need to mark the hospitals and important organization in my OSM map. What I will do for show that.
Given that the whole purpose of this tutorial is placing markers on a map, I think I must be missing some context. Can you explain what you mean? Can’t you just put your hospital names, locations, etc. in the data file?
Hi… I have tried your map in my project. It has successfully worked before two weeks but now it show “Direct tile access has been discontinued”. I need this map in my application permanently. What are I will do for that ????
Very helpful, thanks indeed
Greetings community need help my country is Venezuela ‘m now doing the same for my graduation project and I need to place the names of the streets of the sites displayed on the map , someone could help me
Hello Andy, I wanted to implement the map in different languages adding them as layers.
There will be a dropdown and the user can select the language from the dropdown and the places appear in that language in the map. How can I do it??
Thanks.
I haven’t done this, but the path I would explore would be to create each of the layers & store them, and then when the dropdown menu is activated, use the
addLayer()andremoveLayer()methods on the map object to switch them out.Thanks for such a simple explanation of setting up the map. I’ve been trawling the internet, through many tutorials but this one was perfect. Onto clustering 🙂
Thanks for the kind words Rory. Glad it helped!
Once you’ve got this set up, the clustering is simple thanks to the plugin developed by Dave Leaver.
Hi Andy
Just what I needed to get me kick started and even better I can get other folks to be involved in adding markers to the map we are creating. It is very simple. Thanks.
A quick question though, I have added an image and text to the pop up but there is a max width default to 300. Do you know how I could increase this to 400 please?
Thanks
Rich
Rich:
You need to set the option
maxWidthon the popup. The available options are listed in the leaflet reference.It looks like – after a quick scan of the reference – you’ll need to modify the way the popup is added by creating a popup object and adding it to the map like they show in the code example.
Andy!
Great tutorial, and after a few days of looking at many ‘tutorials’ yours is by far the most concise and easy to understand.
I still cannot get this to work though… I am using WAMP to test on. I have a working map in [code][/code]
All my other coding is as yours except for the file refs.
No markers showing at all…?
Any ideas?
Matt:
(Your code didn’t show up in your comment. I think you can just use <code></code> in a comment.)
The first thing I would do is check that my example is working as expected. If so, then I would load yours and look at the browser’s JavaScript console to see if there are any errors showing up.
When you say the ‘file refs’ are different that could easily be the problem. If it can’t find the file with the markers it will still show the map without them.
Very useful tutorial. Another advantage of using a CDN to fetch js libraries is that they supply minified versions (min.js) which are compressed and transfer fast.
Very nice tutorial mate! Thanks for sharing!
This is really a great example and also helpful discussion after that….I like it…I am doing my masters thesis and might need some help…I will ask later. this time just a Thankx for this tutorial….
Hello,
Thank you very much for this tutorial. It is really what I need but I have to pick out my latitude and longitude from Mysql database and plot them in the map.
Do you have any advice to do this?
Thank you so much,
Soumaya:
I would create a little REST API server using a language such as Go (or whatever language you’re familiar with – Python, PHP, etc…) and access it from the JavaScript to read & update markers.
Thank you so much for this tutorial, it was extremely useful and easy to follow. Wishing you the best from Hungary.
Thanks Zsolt! Glad it helped.
Thank you very much for this detailed tutorial and for sharing your experience with us. Best wishes.
Glad you found it useful Muhammad!
It’s a good tutorial Andi but now i have problem can u help me to make search marker in my map?
I’m not sure what you mean by a search marker. Maybe if you describe in detail what you’re trying to do someone can help?
Hello Andy , nice tutorial . It helps me a lot.
But i have a question , how to show a popup when the user hover the marker ?
Im sorry if this is a silly question , im new in javascript.
I’ve never tried to do this, but maybe this post will point you in the right direction:
How to show a popup on mouse-over, not on click?
Oh nice , problem solved but it took me a hour to understand :v . I have another question , how to make tracking in moving marker ? im sorry for too much asking .
Not sure I understand completely – are you talking about showing a route that changes when you move a marker like Google Maps does?
Again, not something I’ve done, but if that’s what you’re trying to do it’s going to be pretty complicated. You might look at the Leaflet plugins for routing to get you started.
Excellent tutorial, exactly what I needed and works perfectly! Ah there is always a but… json isn’t supported on IIS6 which is where I ultimately need to host this project. Could you point me in the right direction on changing this side of things? Many thanks.
I’m assuming this means that IIS6 won’t serve files with a json extension?
Since I worked on the tutorial about clustering markers in Leaflet, I realized that what I’ve got here is slightly semantically incorrect. It’s not technically a JSON file. If you look at the other tutorial, the markers are simply served as a javascript file which assigns the variable.
Maybe that would help in your case?
Ah-ha. Renaming the file to .txt and editing index.html to point to that instead of the .json file made it all work beautifully! Thanks for the quick reply and once again thanks for this great tutorial!
I would suggest .js since it’s actually JavaScript, but I’m glad you got it working.
I had the same chain of experience as your discovery of Leaflet : Finding google too troubling, checking out OSM, checking out OpenLayers and hitting a wall there, and later on finding Leaflet. Now I’m working on leaflet, being able to do many more things with it and loving it.
Thank you Andy
the prob came from the order i call different scripts in my page
Thanks for your answer
i don’t want use icon actually, just try to work with simple one with markers.
and with this code below, i have error : Uncaught ReferenceError: markers is not definedmap.js?ver=1:36 (anonymous function)
do you see where is the problem ? THANKS
It’s almost impossible to debug these things when just looking at small snippets of code.
It’s telling you that markers isn’t defined, so check that you’ve defined it somewhere. I put it in the ‘maps/markers.json’ file which is included earlier – see the code at the bottom of The HTML section above.
The javascript debugger in Chrome might help you figure this kind of thing out.
Thank you very much for this detailed tutorial and for sharing your experience with us. Best wishes.
hi,
thanks very much.. so simple but..
when i add this line
i get error “Uncaught TypeError: Cannot read property ‘replace’ of undefined”
and without this line i get this error : Uncaught ReferenceError: markers is not defined
any idea ? thanks
Pascale:
You will need to replace leaf-demo.js in this line with whatever you named your javascript file.
This is a little hack to get the URL so we can use it to find out images for the icons. I’m sure there’s a better way to do this, I just haven’t spent the time to figure it out.
i just want to know how to add markers and display route between them on map… so i can get direction between markers
Use Google 🙂
Not sure what level of detail you want, but you could try something like the MapQuest Routing Plugin for Leaflet. Look at the Route Narrative section.
i want code for adding route line in between that marker. so total route will display properly…
I guess I don’t understand what you’re asking. There are nine examples on that page which display a route between two points with different levels of complexity and detail.
Hello ,very good tutorial , but unfortunately Mapquest is not very open :/
http://info.mapquest.com/mapquest-terms-of-use-ca-en/
and maybe i’m bad (^^) but i had no sucess with anoter “maper” ,if you have one idea for …
Thanks,
Without knowing what level of “open” you’re comfortable with or what specifically about the terms you don’t like it’s hard to recommend anything.
As far as I’m aware, there are no other free/open tile sets. The OSM ones themselves, while CC-licensed, are not meant to be used in the wild:
“Apart from very limited testing purposes, you should not use the tiles supplied by OpenStreetMap.org itself.”
(See switch2osm – Using Tiles for more info.)
If you have the resources, you could create your own tiles. Then you’d have total control over “openness”.
Hi Andy, thanks for a brilliantly explained tutorial.
I’m wondering : How can one go about converting a simple excel csv /tsv having the same kind of data : place name, a link, longitude and latitude; and importing that here? Is there a way to convert spreadsheet data into the JSON format you used? Because it’s much simpler for humans to make the table than a JSON.
You can either convert it to JSON “offline” then just use the JSON, or you might consider modifying the code to just read CSV files and convert to JSON using Javascript. It depends on if you need to do it once or multiple times.
To do the former, you can use an online tool like Mr. Data Converter to convert online.
To convert using Javascript, you might look for a library like PapaParse.
thanks for sharing your brilliant example with us.
i have understood how to put markers on desired locations usina a JSON file.
but my query is.
if i am searching for places from for ex. -google maps. we get markers for those locations. this same thing i want to implement in here, such that i will get data in lat and long for places, how to add markers for those places ?
This is beyond the scope of this tutorial, but I would start by looking at the Leaflet documentation to see how to manipulate the map using the API.
Once you have the lat and lng for the point it should be a simple matter of adding a marker using the same javascript methods outlined in this tutorial.
thank you, this is what i need for a kickstart. this simple tutorial is what I was looking for.
I had to make a small change in the iconsURLs, had to make it relative to the index: “maps/images/pin24.png”. since i’m not using mump, the jquery wasn’t working.
Hi Andy,
your post was so use full. it has worked so nice.
Could you please suggest me how to apply mouse over and click event on marker of leaflet map.
Regards,
Ranjeet
Ranjeet:
Have a look at the documentation for leaflet – you can hook into a bunch of different events for markers.
Also see the Dealing with events section at the bottom of the Leaflet Quick Start Guide.
Andy… I wouldn’t make it through my final project at code school without this tutorial! Thank you so much!
Glad it helped. Let me know what we get! 🙂
This tutorial is the best one that i have come across. It is very simple, clear and precise. And the example is very simple and basic which makes understanding the code very easy.
Thank you so much for this blog. It was very helpful. Keep it up.
Thanks Akanksha – I appreciate it!
How about license, can i use this for commercial. not for letting people pay but just set markers where the forests are ore something like that?
Thanks
My code doesn’t have a license – you can do whatever you want with it.
Leaflet and OpenStreetMap have their own license as do any tile sets you use, so you will have to look into that. My understanding is that they just require a note with links on the map, but thankfully I am not a lawyer.
This is a great tutorial, should be linked from the leaflet.js tutorial’s page. Thank you very much!!
I am looking for a way to let users set their own markers and store them (either locally or on a central repository). Any hint about how to do it, or where to look?
Regards,
Ignacio:
As I mention in a comment above, doing this requires some form of persistent storage for the data. This could be reading & writing the JSON file itself or storing it in a database.
I assume you want this available to the internet, not just an intranet (as in the comment above). I think if I were approaching this problem, I would create a little REST API and use it from javascript to read & update markers.
Hope that helps and points you in
the righta direction.Excellent tutorial. It will allow me to start my new map-based project with something working ! Thank you !
You’re most welcome! Good luck with your project.
Do you know if it is possible to make produce dynamic clustered markers in Openstreetmap just like in Google Maps?
Example:
http://component.kitchen/components/google-map-markerclusterer
Thanks!
If you are using Leaflet, Leaflet.markercluster looks promising.
I’ve never used it, but it looks pretty good.
I want to attempt something very similar to this, but with the added ability to let any user add their own pins for new projects (the site will on a LAN, not the internet). What would be the easiest way to add this functionality?
Chris:
Doing this requires some form of persistent storage for the data. This could be reading & writing the JSON file itself or storing it in a database.
How you approach it would depend on what languages and tools you have available, how robust you want your solution to be, the scope of the project (how many locations? how many people accessing it?, etc.), and how much time & effort you want to put into it.
Using a database—if you have one available—would probably be the safest and easiest solution. Then you don’t have to worry about multiple people trying to update the same file on the filesystem at the same time…
OK, and if I wanted the .json file/markers to point to a folder on a server within our domain instead of a URL like your example, how do I make this change in the .json file? BTW great tutorial! I am in way over my head but you made a non-coder feel really smart 😀
Thanks Chris.
The first thing I would try for that kind of setup is:
On the web server create a link to the file somewhere within your htdocs or wherever your web pages are served from. How you do this is dependent on what kind of system you are working on.
Then change this line to reference that URL:
Alternatively – and I’m not 100% sure this would work:
Drag the file to the browser and you should get a file:// URL – something like file:///path/to/markers.json.
Put that in as the src in that script tag.
This would mean (I think) that everyone would have to have the server folder mounted in the same way.
Hi, Andy! Thanks for the tutorial, it’s helped a lot. This is my first experience using JSON at all, so I was wondering if you could help me out with the pop-ups my markers.json file outputs.
Currently I have Name | URL | Lat | Long for each marker, exactly like in your tutorial. But if I’d like any other text to my pop-up, it seems like I need to add into the “name”, perhaps with a little html syntax. But it’s still linked the marker’s URL. Any suggestions? Thanks again.
If I understand your question correctly, you want to be able to put different information in the popup?
The key line is this one (line 25 under the heading Changing The Icon above):
You can add whatever you want in the JSON file, so you might have something like this:
and then use it like this:
(Untested code, but should point you in the right direction.)
thank you a lot sir. you cannot know how much you helped me
best from turkey
Thank you Andy. I’ve decided that presenting a rectangle control for letting the user select a bounding box using Leaflet or OpenLayers is nice, but doesn’t worth the effort (I’ve found how to do it).Instead, I’m telling the user that holding down the shift key while dragging the mouse can be used for selecting a bbox. I’ve added a popup which tells the user what are the current LatLon values, while the shift key is pressed.
Upon zoomend: The selected area occupies all the redrawn map, and I have the coordinates using map.getBounds().getNorth(), etc.
Upon mouseup: map.closePopup();
I hope these details can help someone.
Hi, i’m working on a Box Selection in leaflet, can you help me with some code? 🙂
Thank you !
I think your best bet would be to post specific questions about what you’re having problems with on stackoverflow. Then you’ll have access to a whole community of developers.
Thank you very much for this great information!
I’ve done an extensive search and I still wonder how can I let users define a bounding box on the map, to be used as a geo filter for a search form.
Thanks.
I’m not too sure – I’m certainly not an expert at leaflet. Maybe this post will point you in the right direction:
Multiple marker selection within a box in leaflet
hi
Awesome tutorial ! thanks Andy.
I’m (french) not a developper.
Was wandering if we can load the list of all the markers beside the map with a link to it on the map using the markers.json file ?
Tristan:
It’s certainly possible but I haven’t done it before. Here’s how I would approach it:
1) use the leaflet documentation to figure out how to set up links to specific locations
2) construct the list of links (as HTML) in the loop where I’m setting up the markers (last section of JavaScript)
3) add an empty div to the main HTML where I want to put the list
4) using jQuery, replace the new empty div with the list of links created in step 2
Maybe this post will point you in the right direction:
How to interact with leaflet marker layer from outside the map
FYI
I have placed the above code in an aspx page and i am calling the Initialize() method on body onload
Thanks,
Krupa
I’m afraid I can’t tell what’s wrong with your code. I would suggest starting with the example, replacing the JSON with yours, making sure that works for you, and then adding in the new code bit-by-bit to figure out what’s not working for you.
Sorry, below is my data for the latitude and longitude
var markers = [
{
“lat”: 47.39564,
“lng”: 16.32595
},
{
“lat”: 47.39189,
“lng”: 16.34755
},
{
“lat”: 47.42923,
“lng”: 16.40003
}
Krupa:
If I add the missing closing bracket ]; at the end of your data, and paste that into the example’s markers.json file, the three points show up on the map when I open the example and zoom in.
Maybe there’s something else wrong in your code?
Hi Andy,
Very useful post.
I have data for Germany with below latitudes and longitudes
var markers = [
{
“lat”: 16.32595,
“lng”: 47.39564
},
{
“lat”: 16.34755,
“lng”: 47.39189
},
{
“lat”: 16.40003,
“lng”: 47.42923
}
The problem i am facing is only one marker is visible on the map, may be because the value difference between the markers latitude and longitude is very less.
I am using the center point same as that of yours with values [20 , 5]
Any idea what could be the issue ?
Thanks,
Krupa
I bet this is the case – the points are very close. When you are zoomed out all the way, they will overlap.
I can’t test it myself right now, but what happens when you zoom in to the area, do you see all three of them?
nope, i cannot see the other two on zooming it..
But i can if i use google map
Hello,
Very good tuto !
With you example , you use a the world map , I want to use a part of map ( region , country ) how can i do that ?
Best regards …
If you mean using a different, smaller set of tiles for a region, I think you could just substitute them in when creating the tile layer (see the Javascript code calling L.tileLayer()).
If you mean using one of the provided tile sets and restricting the view to a specific region, then in the Javascript code where you create the map (just under the The Leaflet JavaScript heading) you can set the location to the region you want and play with the minZoom and maxZoom options to restrict it.
Is that what you mean?
Very nice tutorial. Simple and effective. Thanks for your time and effort to help others (like me!).
You’re welcome Jose!
Thanks for the comment – always good to hear that people find some of this stuff useful.
This tutorial was EXACTLY what I needed to kickstart my new project, thanks a lot!
Glad it helped. Good luck with the project!
Very simple and nice tutorial. Thanks Andy!
My pleasure – glad you found it useful!
Hi Andy,
thanks for the tutorial – just a short remark: you might be interested in also trying another WordPress OSM plugin: search for “Leaflet Maps Marker” in the WordPress plugin repository (free version) or download the pro version from http://www.mapsmarker.com – my plugin allows users to pin, organize & show your favorite places & tracks through OpenStreetMap, Google Maps, KML, Bing Maps, APIs or Augmented-Reality browsers
best regards,
Robert
Thanks Robert.
Your plugin is obviously very comprehensive and has tons of neat features – overkill for what I was doing! Besides which I needed to embed this in a non-WordPress site too.
If I ever need more complicated maps I’ll be sure to try it out though.