So you’re creating an interactive map using Leaflet and have diligently added your 8107 markers to the map.
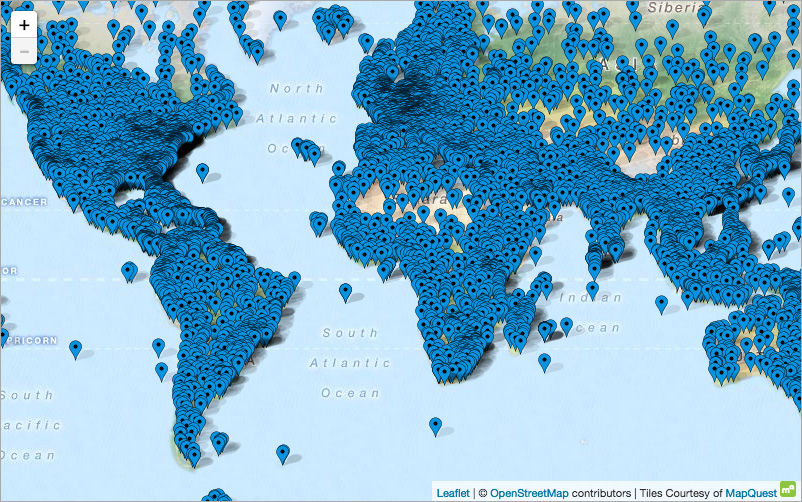
Leaflet – Too Many Markers!
Uh-oh. Definitely slow and pretty much doesn’t provide a user experience. What do we do now?
There’s a great plugin for Leaflet called Leaflet.markercluster by Dave Leaver which will save us.
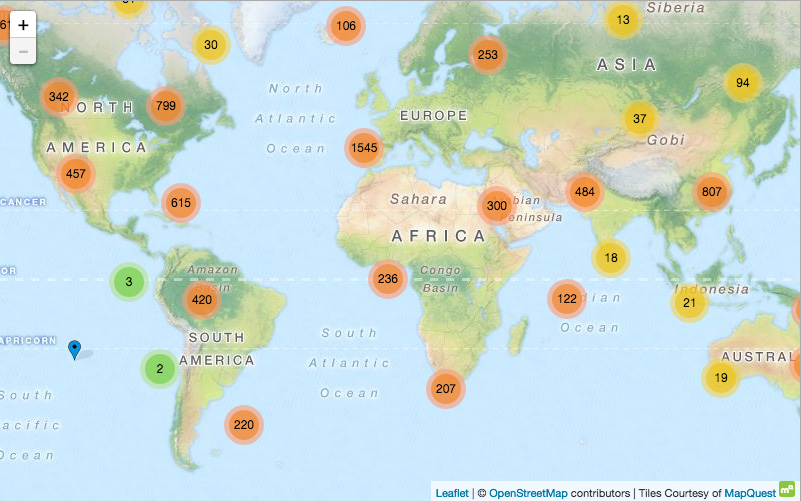
Leaflet Clusters
This plugin clusters the markers and shows the number of items in each cluster, and as we zoom it adjusts the clusters based on the current view. This not only makes the map easier for the user to understand, it’s also a lot more efficient.
If you followed my previous Leaflet tutorial, adding the clustering plugin is extremely simple. Let’s take a look.
Leaflet.markercluster has some cool capabilities. By default, hovering the mouse over an area outlines the area like this:
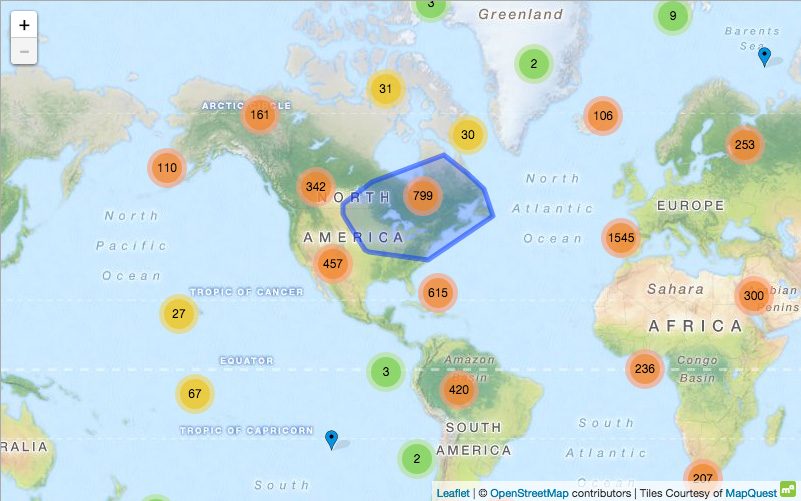
Leaflet Clusters – Hovering
Clicking inside an area zooms in and shows you the next level of clusters:
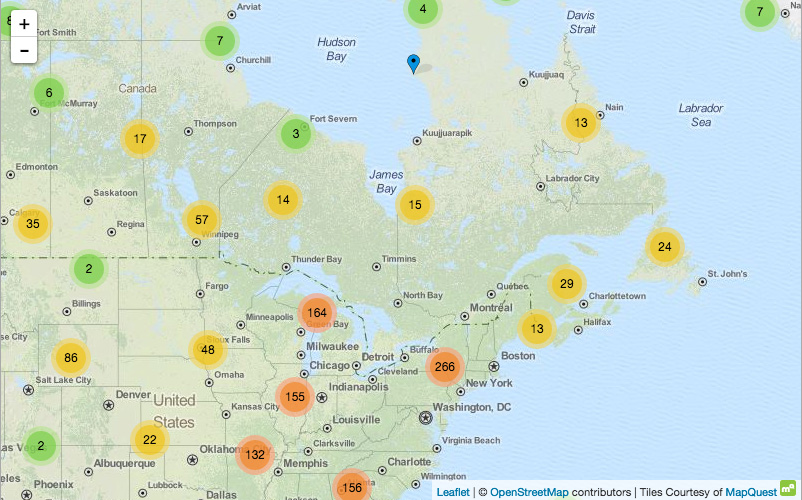
Leaflet Clusters – Zoom In
When a cluster only has one item in it, it shows it as a marker:

Leaflet Clusters – Zoom In Again!
And of course, like the last example, clicking a marker shows more information about the location:

Leaflet Popup
For this example, I’m going to create a map showing the airports and train stations of the world. I grabbed a data set from OpenFlights.org which gives locations and other information for airports and train stations. I downloaded the CSV, converted it to JSON, and collapsed it a bit since it’s rather large.
This example consists of three files and two images:
- index.html – the page itself
- maps/leaf-demo.js – JavaScript to create the map and populate it with markers
- maps/markers.js – a list of markers with their latitude & longitude as well as other info about the location to display in the popup when you click a marker
- maps/images/pin24.png and pin48.png – the pin to display (one for normal display, one for retina)
(The files used in this example are available on GitHub. Note that the version on GitHub will look different that what is outlined here since it has been updated to use more recent versions of the libraries. I recommend using it instead of copying the code on this page.)
The HTML
Let’s start by taking a look at the HTML. This is pretty much the same as the example in the last post and should be fairly straightforward.
|
1 2 3 4 5 6 7 8 9 10 11 12 13 14 15 16 17 18 19 20 21 22 23 24 25 26 |
<!DOCTYPE html> <html> <head> <title>Leaflet Cluster Example</title> <meta http-equiv="Content-Type" content="text/html; charset=UTF-8" /> <link rel="stylesheet" type="text/css" href="http://cdn.leafletjs.com/leaflet/v0.7.7/leaflet.css" /> <link rel="stylesheet" type="text/css" href="http://cdnjs.cloudflare.com/ajax/libs/leaflet.markercluster/0.4.0/MarkerCluster.css" /> <link rel="stylesheet" type="text/css" href="http://cdnjs.cloudflare.com/ajax/libs/leaflet.markercluster/0.4.0/MarkerCluster.Default.css" /> <script type='text/javascript' src='http://ajax.googleapis.com/ajax/libs/jquery/2.1.4/jquery.min.js'></script> <script type='text/javascript' src='http://cdn.leafletjs.com/leaflet/v0.7.7/leaflet.js'></script> <script type='text/javascript' src='http://cdnjs.cloudflare.com/ajax/libs/leaflet.markercluster/0.4.0/leaflet.markercluster.js'></script> </head> <body> <h1>Leaflet Cluster Example</h1> <p>Here's an interactive map indicating where airports and train stations are located around the world. The data comes from <a href="http://openflights.org/data.html" target="_blank" rel="noopener">OpenFlights.org</a>. <div id="map" style="width: 800px; height: 500px; border: 1px solid #AAA;"></div> <script type='text/javascript' src='maps/airports.js'></script> <script type='text/javascript' src='maps/leaf-demo.js'></script> </body> </html> |
The only significant changes here are that I added two stylesheets and one javascript for leaflet.markercluster. If you want to customize the look of the cluster indicators, you can override the stylesheets.
The Leaflet JavaScript
The first part of this is the same as the last example. We create the map, set up the tiles, and create our icon.
|
1 2 3 4 5 6 7 8 9 10 11 12 13 14 15 16 17 18 19 20 |
var map = L.map( 'map', { center: [10.0, 5.0], minZoom: 2, zoom: 2 }); L.tileLayer( 'http://{s}.tile.openstreetmap.org/{z}/{x}/{y}.png', { attribution: '© <a href="https://www.openstreetmap.org/copyright">OpenStreetMap</a>', subdomains: ['a','b','c'] }).addTo( map ); var myURL = jQuery( 'script[src$="leaf-demo.js"]' ).attr( 'src' ).replace( 'leaf-demo.js', '' ); var myIcon = L.icon({ iconUrl: myURL + 'images/pin24.png', iconRetinaUrl: myURL + 'images/pin48.png', iconSize: [29, 24], iconAnchor: [9, 21], popupAnchor: [0, -14] }); |
And here are the changes needed for adding clustering:
|
22 23 24 25 26 27 28 29 30 31 32 33 34 35 36 37 38 39 |
var markerClusters = L.markerClusterGroup(); for ( var i = 0; i < markers.length; ++i ) { var popup = markers[i].name + '<br/>' + markers[i].city + '<br/><b>IATA/FAA:</b> ' + markers[i].iata_faa + '<br/><b>ICAO:</b> ' + markers[i].icao + '<br/><b>Altitude:</b> ' + Math.round( markers[i].alt * 0.3048 ) + ' m' + '<br/><b>Timezone:</b> ' + markers[i].tz; var m = L.marker( [markers[i].lat, markers[i].lng], {icon: myIcon} ) .bindPopup( popup ); markerClusters.addLayer( m ); } map.addLayer( markerClusters ); |
Line 22 creates a cluster group. There are several options which can be passed here to customize it.
Next, for each element in the JSON data, we create a marker on the map, set the popup for it to display additional information, and add it to a new layer in the cluster group.
Finally in line 39 we add the cluster group as a layer on the map.
That’s it. We’re done.
The JSON Data
As I mentioned above, I downloaded a data set from OpenFlights.org and converted it to JSON data. I made this into a JavaScript file which just sets a variable. This lets us include this file as straight Javascript and to use the markers variable as-is.
|
1 2 3 4 5 6 7 8 9 10 11 12 13 14 15 16 17 18 19 20 21 22 23 24 25 26 27 28 29 30 31 |
var markers = [ { "name":"Goroka", "city":"Goroka, Papua New Guinea", "iata_faa":"GKA", "icao":"AYGA", "lat":-6.081689, "lng":145.391881, "alt":5282, "tz":"Pacific/Port_Moresby" },{ "name":"Madang", "city":"Madang, Papua New Guinea", "iata_faa":"MAG", "icao":"AYMD", "lat":-5.207083, "lng":145.7887, "alt":20, "tz":"Pacific/Port_Moresby" },{ ... },{ "name":"San Diego Old Town Transit Center", "city":"San Diego, United States", "iata_faa":"OLT", "lat":32.7552, "lng":-117.1995, "alt":0, "tz":"America/Los_Angeles" } ]; |
Final Result
Try it out!
I hope this is useful to someone out there in and amongst this series of tubes we call The Internet.
(The files used in this example are available on GitHub. Note that the version on GitHub will look different that what is outlined here since it has been updated to use more recent versions of the libraries. I recommend using it instead of copying the code on this page.)
As always, if you have suggestions on how to improve my code or make things easier, please comment below or feel free to contact me.
Update 06 May 2021 (GitHub code):
- Updated to Leaflet 1.7.1, leaflet.markercluster 1.5.0, and jQuery 3.6.0.
- Added Subresource Integrity to CSS and CDN JavaScript.
- All files reformatted with prettier.
- Use https for URLs.
Update 12 July 2016: MapQuest discontinued the tile set I was using, so I switched to OpenStreetMap’s tiles. Note that these are useful only for testing. They say on their site:
Apart from very limited testing purposes, you should not use the tiles supplied by OpenStreetMap.org itself.
Update 12 July 2016: Updated example to use Leaflet 0.7.7 (no code changes, just including newer version of javascript).
How can i set the minWidth of the Popup.
Documentation of Leaflet says:
var popup = L.popup(minWidth:500);
But in your script : var popup = markers[i].name + etc.etc.
I haven’t tried it, but this answer says you can do the following:
Great project. Quick question – sometimes I have noticed after I created my own local copy using the files, when I zoom in or out, occasionally some of the group markers and some of the markers that should display as the lowest level markers also don’t appear.
I hit F5 and it resets everything.
Any thoughts?
Cheers
I’ve updated the project on GitHub to the latest versions and latest development practices. See if that helps. If not, check your developer console when you load the page to see if it’s throwing any errors.
Hi,
Today my site upgraded to https secured site. My starting page kept empty.I use leaflet V0.4.0 and Markercluster V0.7.7. After upgrade leaflet to V1.03 I can see map, but no markers. How can i solve this problem. Thanks in advantage
I would start by looking at your developer console to see if you have any errors showing up.
When switching from http to https you’ll need to make sure that all your script links and so on use https otherwise you’ll get “mixed content” errors with some browsers.
Hi and thanks!
We at MadAppGang developed a tool for clustering geopoints: https://madappgang.com/blog/what-is-geoclustering-how-to-handle-200-000-points-on-the-map
Our Gocluster, based on KD-tree geospatial index, groups points using Mercator projection at different scales.
Hi Andy,
Thank you for these scripts and the detailed explanation. My very basic knowledge of html and javascript is sufficient to get this working. On my site, http://polten.be, I’m sharing gpx tracks. I’m using the cluster plugin to show the starting point of each track on a map.
Good stuff! Glad it helped.
Heyho,
thanks for your great explanation!
Sadly I am working with WordPress, where I can’t just create a website with custom html.
Do you have any hint how to use Clustering on WordPress?
Thank you in advance and have a wonderful day!
I’m using it on WordPress as well. If you are using it on a “managed” server (like wordpress.com) then I don’t know if it’s possible.
If you are managing the site yourself, then you have to put the scripts & files in your theme directory and reference them directly. I put the JSON and the JavaScript in its own directory (“maps”) and then embed the map in a page by writing and using custom shortcodes.
Hi there,
Thanks for explanation. I want to know one thing that is it possible to save the clusters that leaflet makes in a new column in my table. for example if they are 2 locations beside each other and they clustered together in leaflet, in cluster column have 1 for each of them as cluster label?
I need that and if there is something to save that, it would be great as I don’t like the result of my knn clustering.
I’m not 100% sure I understand your question. Is it that you want to use this plugin to cluster your data, then output that information to use elsewhere? i.e. use it to process your data once? (Also – won’t you need a cluster number for each level of zoom?)
If that’s what you’re trying to do – wouldn’t it be easier to find/implement a clustering algorithm separately?
I’m using data being pulled with SQL on the same file. How could I add this to the cluster?
It should be no different – just add the items to the cluster group (see the section The Leaflet JavaScript).
Can you post a jsfiddle version of this please? I can’t get it to run on a jsfiddle myself and this looks like a great way to learn.
Someone used JSFiddle for an example in Dec 2016 – see this comment – but I couldn’t get it to work. I don’t use JSFiddle, but maybe that will help?
Hello, thank you for this helpful tutorial.
I tried to realize a map leaflet with cluster, i keep track your method,it display just the markers whithout cluster and with an error ‘ t is null’ in the file leaflet.js
anyone has any idea for that, i need a help!!
thnx 🙂
I would suggest opening it in Chrome and using the developer tools to see what’s going on. Figure out where it’s giving that error then look at the call stack and step through the code to see where it’s failing.
Also check the versions – things may have changed since I wrote this post. This example is using Leaflet 0.7.7 and MarkerCluster v0.4.0.
okeey it display now. thnks 🙂 🙂
Hi All, I have created one blueprint map by CATileLayer as imageView on ScrollView in Objective c. According to the selected location i pin the point (CGPoint(x,y)) so i have around 1000 CGPoint. As of now i have to do cluster marker for according to the CGPoint. Is it possible to do cluster marker by leaflet ? if it’s there please comment here.
I am using cluster group. But how to fix cluster expand level. Suppose default cluster group loads with continent level then click. It expand to deeper level and when third click on cluster group again it expand to country level. I want to fix three expand level of cluster group.
I tried freezeAtZoom() but it stops the cluster group from expand even from first level..
Hi, how do i get rid of the hover recangle thingies… thanks
If you’re talking about the area outlines, there is an option for that. See the plugin documentation on options for details.
Hi
Instead of the aggreated count as number , i want to fill the colour in that geo polygon like choropleth
How to do that?
Thank you
I don’t think the cluster plugin does that out of the box. You would need to modify the plugin code. If you get it working, please consider submitting the changes to the project as a pull request.
Hello
I try to apply your tutorial on api
http://backend.geovelo.fr/api/v1/bikestations?geoaggloId=2
how you made to incorporate the data in this leaflet or transform the data size geojson
Thank you
Diouck:
I’m not sure I understand your question.
You have some data which includes coordinates – are you asking how to access the coordinates within that data structure? Or are you asking how to extract the coordinates and put them in a GeoJSON file?
Thank you very much for your tutorial very helpful. Can you plz tell me what wrong with my code. It only works when I have one point. When I try to loop more than one nothing is displayed.
I would suggest opening it in Chrome and using the developer tools to set a breakpoint on the
forloop to check thatpoint.lengthis returning what you think it should return. Then step through that code to see what’s not working as expected.Have you tried any heatmaps ?
I have not because they didn’t really fit my use-case, but there are a few options and they do look cool.
What needs to be changed if we want to convert this example to work with Leaflet v 1.0.0 beta 0.2 ?
I have no idea – I haven’t looked at the Leaflet betas. Have you tried this with the beta and it doesn’t work?
it works … tried it with markercluster v1 beta 2 and leaflet v1 beta 7
Great! Thanks for checking it out.
This is awesome. Thank you so much…
Glad you found it useful!
It saved my day for sure. Thank you. I stumbled into an issue and if you know off the top of your head please feel free to advise.
I am adding a link on each of the popups and then ajax loading another page into a div when the link is clicked. Once the ajax load happens, the leaflet map becomes unresponsive. At first I thought it was due to my code, but I removed the clustering part and it works fine.
I am attaching the code below. I am not asking you for a full fledged solution but if you have seen this behavior or have an insight, please feel free to share:
I am attaching an event handler to each of the items with class ‘link’ like this:
I am ajax loading a different page in the createDialog method like this:
Thanks
Hi,
Thanks for your detailed explanation about marker clustering in openstreetmap with leaflet.
I understood as, currently marker clustering are works based on distance, right?
I want to cluster markers based on region, for example cluster all markers in a particular country or state.
Can anyone help me!
This clustering plugin does not currently support this and the author does not plan to add it.
There might be other plugins that handle this?
http://regionbound.com has been around for a while
Thanks Rik – I’ll let your ad through because it looks like it would be useful for some people 🙂
(This is a fork of the clustering plugin I’m using in this example. Looks like almost a drop-in replacement.)
The following approach (also using leaflet clustering) uses multiple layers.
http://jsfiddle.net/7vctfy0n/
I couldn’t get the jsfiddle to work, but the code’s there to examine. Thanks!